
Housing Reports
Triangle NC Real Estate Market Report
Updated on 6/17/2026
Raleigh NC Housing Data From May 2026
Market Report Navigation
Getting Ready For a Sizzling Summer
It's almost summer in Raleigh NC, and the market is rising along with the temps! The May 2026 data from Doorify MLS is officially in. If you have been watching the headlines lately, you know the word of the year is balance. While the frenzy of the early 2020s has subsided, the market momentum across our local communities is undeniably picking up. Interest rates remain a wild card for the market. Some experts predict that the FED will keep rates unchanged, while others speculate that they may have to raise rates later this year.
At Five County Specialists🔑, we believe that accurate data is the key to making confident moves. Let's look at the numbers that shaped our market last month and what they mean for your next move.
Watch June's Raleigh Real Estate Update Video
The Big Picture: May Numbers
May prices moved up 1.3% month-over-month in the Triangle. We saw -10.5% fewer homes hitting the market and 8.4% more buyers signing on the dotted line. This could be a recipe for another inventory squeeze. However, sometimes there's a summer lull in the Raleigh real estate market as people go on vacation. Stay tuned to see if Triangle inventory levels continue to shrink.
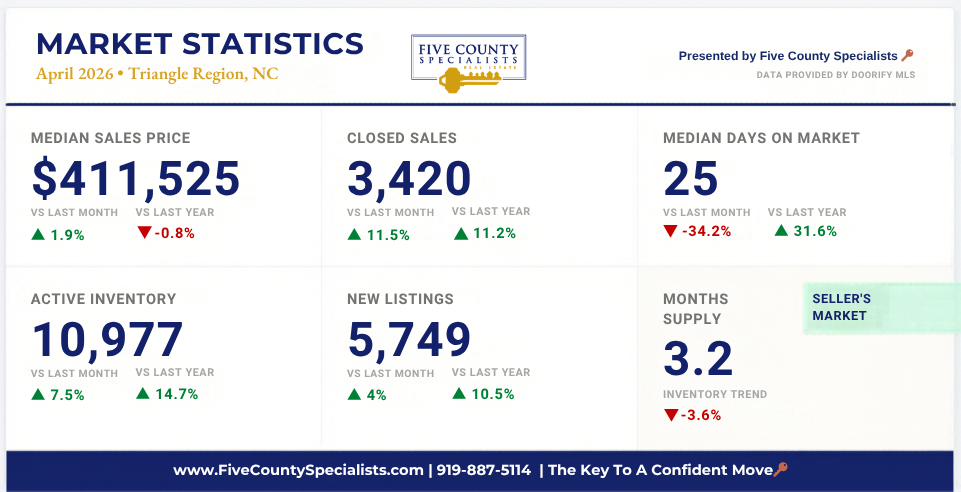
Key Triangle Stats Comparing May 2026 to April 2026:
- The Median Sales Price reached $416,250, which is up 1.3% from April.
- Median Sold Price per SqFt increased 1.4% to $210.
- Closed Sales hit 3,729. That's 8.4% more than in April.
- New Listings came down to 5,159. That's 10.5% fewer than April.
- Active Inventory grew to 11,388, a 2% increase in total choices for buyers.
- Median Days on Market (DOM) fell to 22 days, down 12% from last month.
- Home Affordability slipped to 86, a 1.1% decrease.
- List Price Received held steady at 98.9%.
- Months of Inventory (MOI) dropped to 3.1, a 5.9% decrease, keeping us firmly in a Seller's Market.
Today's Triangle Real Estate Data
Below find automatically updated real estate data from DMLS based on today's market.
| SF Detached Homes | Condos/Townhomes | Land | |
| New Listings Count (2wks) | |||
| Active Listings Count | |||
| Under Contract/Pending Listings Count | |||
| Recently Sold* Listings Count | |||
| Average For Sale Price (New Listings) | |||
| Average For Sale Price (Active) | |||
| Average Price (Under Contract/Pending) | |||
| Average Recently Sold* Price | |||
| Avg Price Per Square Foot: Active | N/A | ||
| Avg Price Per Square Foot: Pending/Under Contract | N/A | ||
| Average Price Per Square Foot: Recently Sold* Listings | N/A | ||
Comparing the Housing Market to Last Year
When we look at where we were exactly one year ago, the shift toward a normalizing market is even clearer. Active inventory has grown by 7.7% compared to last May, and homes are waiting for buyers 10% longer than they were a year ago. Despite those changes, the median sales price has remained remarkably steady, rising only 0.3% year over year.
What The Latest Triangle Real Estate Data Means For You
For Buyers: The Seller-Tilted Balance
With 3.1 months of supply currently on the market, the Raleigh area is solidly in a Seller's Market. However, it is more stable and balanced, giving buyers more time to consider homes. The really good news for buyers is that Home Affordability in the Triangle sits at 86, a nearly 23% improvement compared to May 2025.
Pro Tip: Consider Stale Gems: These are overlooked homes that have been sitting for 60 days or more. Likely, they were initially overpriced. Some of these sellers have already started reducing prices. As they get tired of the grind of having their home on the market, they become more motivated to sell. This is where you may be able to negotiate deals, including rate buy-downs or significant closing cost credits to help offset today's interest rates.
For Sellers: Precision Pricing at Listing is Paramount
Though it is a Seller's Market, homeowners are currently receiving about 98.9% of their list price on average. We can also compare today's average for sale price () to today's average sold price () to see if there is a disconnect between what sellers are asking and what they're actually getting on average.
With rates currently back in the mid-6s, buyers are more sensitive to value. To stand out and market, your home needs to be staged beautifully and priced accurately from day one. Resist the urge to overprice your home. History and Pricing Psychology tells us that the winning pricing strategy is to price at or just below market value attracting buyers and momentum right away. Pricing too high will cause your home to get passed over and become stale. Stale listings attract low-ball offers, and can cost you more in the long run.
Properly priced and marketed homes are still selling within days after being listed for sale. If you want to sell fast for more, it's imperative to use the right home-selling strategy at listing.
- Do: Price strategically and properly prepare your home to be as move-in ready as possible.
- Don't: Price your home high to "leave room to negotiate" or ignore minor maintenance or updates.
What Could Your Home Sell For Today?
Whether you're thinking about selling (or you're just curious) you can keep track of the value for free. Simply tell us about your home, and we'll send you a free report.
The Triangle East Advantage
On the eastern side of the Triangle, we continue to see incredible value. While the Triangle-wide median price sits near $416,250, East Wake communities often offer more house and land for the dollar. We are seeing buyers looking here for space without the Western Wake price tag. In Zebulon, for instance, the Median Sales Price in May was $353,000. While Cary's Median Sales Price was $642,500, and Apex came in at $619,840.
Go a little further East of Raleigh, and the Median Sales Price comes down even more. Rocky Mount's Median Sale Price was $230,950. Louisburg was $330,000, and homes are selling quickly here, with a Median Days on Market of only 19. If you're considering a move to Triangle East, reach out to us for guidance.
Town By Town: See Today's Market Data By City (More Coming Soon)
Why Choose The Five County Specialists Team?
In a shifting market, experience matters. There are many names out there, but there is only one true Five County Specialists team. We live, work, and serve right here in our local communities. We eat, sleep, and breath Triangle East real estate. We've been in the business a long time, and we have extensive experience in a myriad of real estate transactions, from buying land and building your dream home to buying investment properties and everything in between, we've done it, and we would be honored to help you achieve your real estate goals.
FAQs: Frequently Asked Triangle Housing Market Questions
- Is the Triangle housing market shifting to a buyer's market in 2026?
Not based on the numbers right now. As of our June 2026 report, the market is officially a Seller's Market at ~3 Months of Inventory. While Active Inventory rose slightly, New Listings fell 10.5% and closed sales rose 8.4%. May data showed that buyers entered the market, possibly to lock in lower rates. Pair that with fewer sellers listing their homes, and we have a recipe for the Seller's Market to strengthen.
- Are home prices in Wake County finally falling?
Broadly, no. In fact, we are seeing prices rise slightly. While May's median sales price in Wake County moved up slightly to $479,000, some sub-markets saw slight dips last month, while others saw continued appreciation. The theme of 2026 is a normalizing Wake County housing market.
- Should I wait for mortgage rates to drop before buying in the Triangle?
Waiting for the "perfect" rate can be a risky strategy in the Raleigh area. Data from February 2026 suggests that as soon as rates dipped into the high 5% range, buyer demand surged immediately, often leading to multiple-offer situations that drove prices up. Additionally, rates are not expected to drop this year. In fact, some experts think rates could go back up. It's best to buy when you're ready. If rates do go down, you can refinance. If they go up, you will have a good rate and equity.
- Where can I find the best real estate value near Raleigh right now?
The "East Wake" and "Triangle East" corridor is a strong value play in 2026. While core Raleigh and Cary prices hover between $440k and $630k, the latest data shows that communities like Zebulon, Wendell, and Knightdale offer median prices in the high $300s. These areas provide more square footage and larger lots without the high Western Wake price tag.
- What is a "Stale Gem" and how can it help me as a buyer?
A "Stale Gem" is a home that has been active for 60 days or more. These sellers are often much more motivated to offer concessions, such as paying for your closing costs, compared to a home that just hit the market this week.